
“What’s your overhead?” is the most frequent question I’m asked about the health of my practice from other surgeons. It’s also the least informative as far as I’m concerned. This week I’ll be posting about various metrics we use to monitor wait times, efficiency and practice management. I’ve left out quality measures which are a separate but related subject.
If the basic premise of good practice management is to do what is best for the patient in a fiscally responsible manner costs become less important than efficiency. The most basic measure of efficiency is the number of days worked. Some clinics use available appointment slots, provider hours or other measures of the amount of provider time available to patients. I prefer doctor days. It has some inherent weaknesses, such as when I spend a couple of hours working administration rather than with patient time but in our practice that time becomes statistically insignificant.
In a fee-for-service model doctor days is highly predictive of revenue. We’ve found that doctor days account for 82% of the variation seen in revenue with a mix of clinic and hospital work (see picture below). When the work is confined to just the clinic, doctor days is even more predictive of revenue.
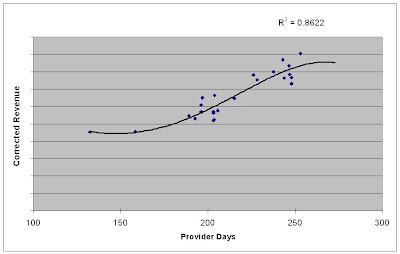
Notice that the curve plateaus at the far right. There comes a point where you can work more but not generate any more revenue. The days become less efficient as the patients spread out over more and more days. As I’ve posted before doctor days does not correlate well to wait time (in a well managed practice) so there is no benefit to work beyond the edge of the curve for either the patient or doctor.
Since doctor days and revenue correlate so well an easy metric to track is Average Daily Revenue (ADR) which is gross revenue (in real dollars) divided by doctor days. Using real dollars to compare year over year changes backs out inflationary changes.
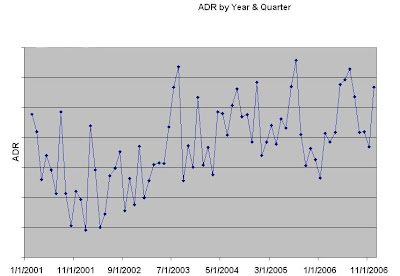
Because of natural variation quarterly analysis should be used rather than month to month. From a practical point of view create a spreadsheet with the first date of the month, gross revenue, corrected dollar amount, days worked and average daily revenue. Create a pivot table using the data and group the dates by year and quarter.
Ungrouped:
Grouped:
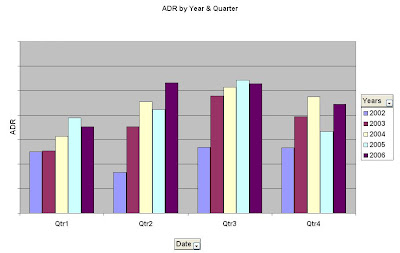
See the video below -- grouping dates is at 4:18 in the video:
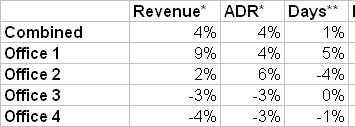
Using the three metrics doctor days, revenue and average daily revenue is simple and informative. If doctor days go up and average daily revenue goes down such that gross revenue has a net zero change the office is less efficient. Either cut doctor days or increase efficiency. Conversely, if the doctor days drop, ADR should increase (fewer days should concentrate patients). A drop in ADR and doctor days is a good indicator of a problem from an administrative point of view. Our office uses these three statistics to predicatively plan doctor days in different offices to maximize overall efficiency.
If the basic premise of good practice management is to do what is best for the patient in a fiscally responsible manner costs become less important than efficiency. The most basic measure of efficiency is the number of days worked. Some clinics use available appointment slots, provider hours or other measures of the amount of provider time available to patients. I prefer doctor days. It has some inherent weaknesses, such as when I spend a couple of hours working administration rather than with patient time but in our practice that time becomes statistically insignificant.
In a fee-for-service model doctor days is highly predictive of revenue. We’ve found that doctor days account for 82% of the variation seen in revenue with a mix of clinic and hospital work (see picture below). When the work is confined to just the clinic, doctor days is even more predictive of revenue.
Notice that the curve plateaus at the far right. There comes a point where you can work more but not generate any more revenue. The days become less efficient as the patients spread out over more and more days. As I’ve posted before doctor days does not correlate well to wait time (in a well managed practice) so there is no benefit to work beyond the edge of the curve for either the patient or doctor.
Since doctor days and revenue correlate so well an easy metric to track is Average Daily Revenue (ADR) which is gross revenue (in real dollars) divided by doctor days. Using real dollars to compare year over year changes backs out inflationary changes.
Because of natural variation quarterly analysis should be used rather than month to month. From a practical point of view create a spreadsheet with the first date of the month, gross revenue, corrected dollar amount, days worked and average daily revenue. Create a pivot table using the data and group the dates by year and quarter.
Ungrouped:
Grouped:
See the video below -- grouping dates is at 4:18 in the video:
Using the three metrics doctor days, revenue and average daily revenue is simple and informative. If doctor days go up and average daily revenue goes down such that gross revenue has a net zero change the office is less efficient. Either cut doctor days or increase efficiency. Conversely, if the doctor days drop, ADR should increase (fewer days should concentrate patients). A drop in ADR and doctor days is a good indicator of a problem from an administrative point of view. Our office uses these three statistics to predicatively plan doctor days in different offices to maximize overall efficiency.


No comments:
Post a Comment